Auto-divergence markers
Detects regular and hidden bullish/bearish divergences on close and marks them inline on the oscillator.
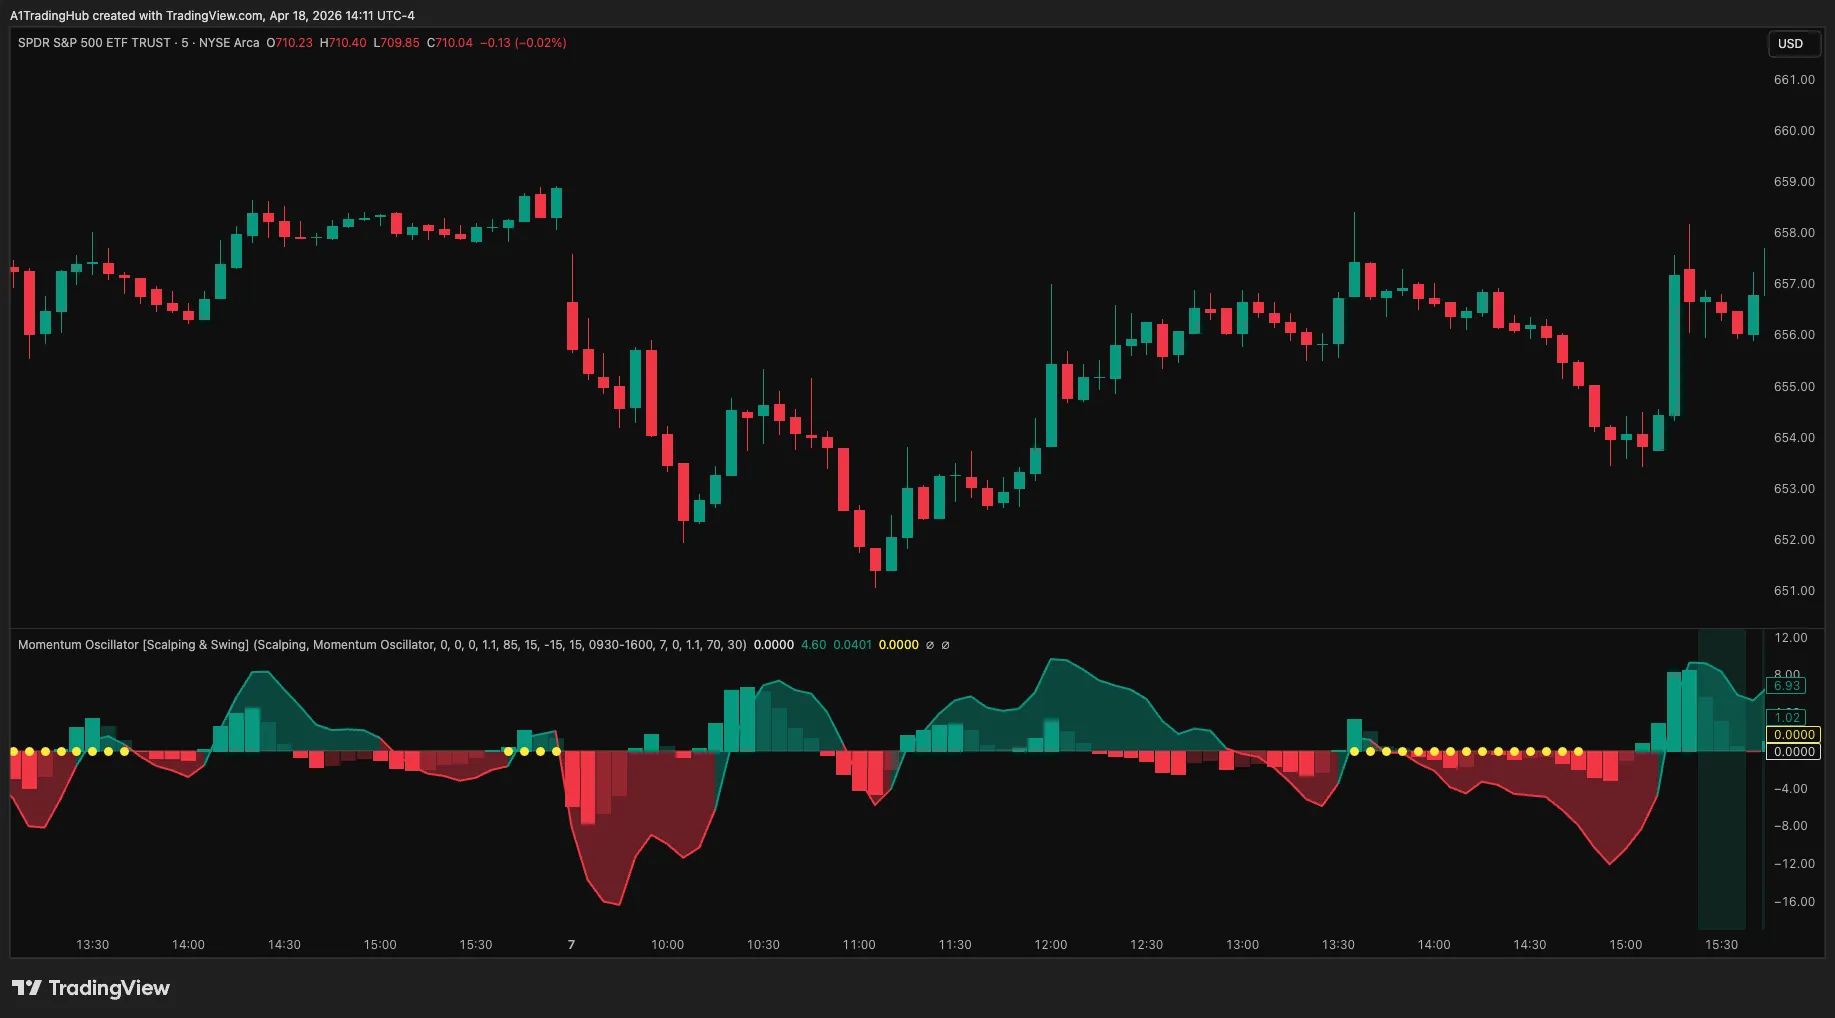
One normalized line for every momentum shift. Auto-flags regular and hidden divergences so you can fade exhaustion or ride the next leg.
Momentum Oscillator collapses RSI, stochastics, and volume-weighted momentum into a single normalized line that reads cleanly across every timeframe and asset class. Regular and hidden divergences are detected and marked inline — no more squinting at three sub-charts. Custom smoothing kernels let you trade it as a fast scalping oscillator or a slow swing confirmation tool.
Each feature below has its own anchor link so you can deep-link from your notes, Discord, or another article.
Detects regular and hidden bullish/bearish divergences on close and marks them inline on the oscillator.
Merges RSI, stochastics, and volume-weighted momentum into one comparable line — same scale on every symbol.
Adaptive OB/OS bands respond to recent volatility so the same threshold works on TSLA and EURUSD.
Discord webhook alerts fire on cross of zero, OB/OS exit, and confirmed divergence — three triggers, your choice.
Choose EMA, HMA, or Kaufman AMA smoothing to match your trading style — fast for scalps, slow for swings.
On-chart panel shows momentum direction across 1m, 5m, 15m, 1h, and 4h so you can stack confluence at a glance.
Momentum Oscillator is symbol-agnostic. Below are the markets we actively trade and have tuned the defaults for.
| Asset Class | Symbols |
|---|---|
| Futures | ES, NQ, RTY, CL, GC |
| Options (0DTE) | SPY, QQQ, SPX, NDX |
| Forex | EURUSD, GBPUSD, USDJPY, AUDUSD |
| Crypto | BTC, ETH, SOL |
| US Equities | AAPL, NVDA, TSLA, AMD |
Everything you need to set up, run, and trade with Momentum Oscillator — written by the Scalping-Algo desk.
The Momentum Oscillator isn't just another oscillator; it's a sophisticated synthesis of proven momentum-measuring concepts, engineered by Andy Tran to provide a clearer, more decisive view of the market. At its core, it merges three critical components into a single, normalized 0-100 line. First, it incorporates the classic RSI (Relative Strength Index) to gauge the speed and change of price movements. Second, it integrates a Stochastic oscillator to assess an asset's closing price relative to its high-low range over a set period, which is crucial for identifying overbought and oversold conditions.
The third, and most unique, element is a volume-weighted momentum component. By factoring in VWAP (Volume-Weighted Average Price) calculations, the oscillator gives more weight to price movements that are backed by significant volume. This allows it to differentiate between weak, low-conviction moves and strong, institutionally-backed trends. This fusion creates a highly responsive yet smooth normalized oscillator, offering a more nuanced perspective than its predecessors.
The indicator's primary function is to automatically detect and display divergences. A regular 'classic' bearish divergence appears when the price makes a higher high, but the oscillator makes a lower high, signaling potential exhaustion and a pending reversal. Conversely, a regular bullish divergence occurs when the price forms a lower low while the oscillator forms a higher low. Crucially, the indicator also identifies hidden divergence, a powerful signal for trend continuation. A hidden bullish divergence happens during an uptrend when the price makes a higher low, but the oscillator makes a lower low, often indicating a prime entry point to rejoin the trend. All divergence signals are confirmed and printed on the chart *after* the candle closes, ensuring they do not repaint and providing traders with reliable, non-lagging information.
To harness the full power of this premium TradingView divergence indicator, you must tailor its settings to your specific trading style and timeframe. The 'Smoothing Kernel' is your first key decision. We offer three distinct types: EMA (Exponential Moving Average), the default, provides a good balance of responsiveness and smoothness. HMA (Hull Moving Average) is significantly faster and more responsive, making it ideal for scalping strategies where entering a few bars earlier is critical. Conversely, the Kaufman (Kaufman's Adaptive Moving Average) is the smoothest, designed to filter out market noise and focus on the primary trend, making it the superior choice for swing trading and position holding.
The 'Period' setting controls the lookback window of the oscillator. For scalping, especially on lower timeframes like the 1-minute or 5-minute, a shorter period of 14 to 28 is recommended. This makes the oscillator highly sensitive to immediate price action. For swing trading on the 1-hour, 4-hour, or daily charts, a longer period in the 50 to 100 range will prove more effective, capturing the broader market momentum and avoiding false signals from minor fluctuations. The 'Overbought' and 'Oversold' bands (defaulting to 80 and 20) define the exhaustion zones. Aggressive scalpers might tighten these to 70/30, while conservative swing traders might widen them to 90/10 to act only on extreme readings.
Finally, 'Divergence Sensitivity' adjusts how pronounced the difference between price and the oscillator must be to trigger a signal. The default setting of 2 is optimized for most conditions. Increasing it to 3 or 4 will result in fewer, but arguably higher-probability, divergence signals. Scalpers might keep it at 2 to see more potential setups, whereas a swing trader may increase it to filter for only the most significant and obvious divergences. Experimentation on a demo account is always advised to find the settings that best align with your risk tolerance and strategy.
Trading 0DTE (zero days to expiration) options requires precision, speed, and a clear understanding of short-term exhaustion points. The Momentum Oscillator is an invaluable tool in this high-stakes environment. Let's walk through a common scenario: scalping SPY puts on a day of strong upward trending price action that is showing signs of weakening. It’s 2 PM EST, and SPY has been grinding higher all day. The price chart prints a new high for the session, tempting breakout traders to go long. However, a glance down at the Momentum Oscillator tells a different story.
While the price made a higher high, the oscillator has printed a distinct lower high. A red 'Bear Div' label appears on the chart as soon as the candle closes, confirming a classic bearish divergence. This is a clear signal that the buying momentum is waning, despite the new price high. The volume-weighted component of the oscillator gives us extra confidence that the recent push-up was not as strong as the price action suggests. This is a high-probability setup to fade the move, anticipating a reversal or at least a significant pullback.
With the confirmed divergence as our entry trigger, we could purchase SPY 0DTE put options just below the current market price. The risk is clearly defined: a stop loss can be placed just above the recent high on the SPY chart. If the price continues to push higher and invalidates the divergence setup, the loss is contained. In this example, the oscillator's signal proves correct. Over the next 30-45 minutes, the price begins to fall as the buying pressure evaporates. The oscillator crosses below the 50-line, confirming the shift in momentum. The puts rapidly gain value, and we can exit the position for a substantial gain, a direct result of acting on a mechanically-identified exhaustion signal.
Swing trading is a game of identifying and riding the primary trend. While classic divergences are excellent for spotting reversals, 'hidden divergence' is the professional’s tool for finding high-probability re-entry points in an established trend. Let's consider a EURUSD swing trade on the 4-hour chart. The pair has been in a clear, structural uptrend for the past several weeks. After a strong impulse leg up, the price begins a natural pullback or consolidation.
During this pullback, the price action on the EURUSD chart forms a higher low, which is constructive and respects the underlying bullish trend. Many traders might hesitate, unsure if the pullback is over or if the price will drop further. However, the Momentum Oscillator provides the missing piece of the puzzle. At the same point where the price forms its higher low, the oscillator has dipped to form a *lower* low. The indicator prints a green 'Bull Hidden Div' label upon candle close. This hidden bullish divergence is a textbook signal that the underlying trend is strong and the pullback is likely a reloading opportunity before the next leg up.
Acting on this confirmation, a swing trader can confidently enter a long position. The stop loss would be placed below the recent swing low (the higher low on the price chart), creating a favorable risk-to-reward ratio. The take-profit target could be the previous major high or even higher, anticipating a new leg of the uptrend. In this scenario, the hidden divergence signal accurately marks the end of the consolidation phase. The price resumes its ascent over the following days, and the trader rides the continuation of the multi-week trend. This demonstrates the power of using hidden divergence to participate in major market moves, a core strength of our indicator.
Discipline and timely execution are hallmarks of a successful trader. The Momentum Oscillator is built with powerful, customizable alerts to ensure you never miss a critical setup. You can create an alert for several key events, directly from the TradingView alert panel. The first and most important are the 'Confirmed Divergence' alerts. You can set an alert to trigger the moment a 'Bear Div', 'Bull Div', 'Bear Hidden Div', or 'Bull Hidden Div' signal is confirmed on the close of a candle. This means you don't have to be glued to your screen waiting for a setup to materialize; you'll be notified the instant a high-probability signal appears.
Beyond divergences, you can set alerts for when the oscillator line crosses key levels. A 'Zero-Cross Alert' (crossing the 50-line) can signal a significant shift in momentum from bullish to bearish territory or vice-versa, which can be used as a trend confirmation signal. Additionally, you can create alerts for when the oscillator enters or exits the Overbought/Oversold bands. For example, an alert for when the oscillator *exits* the oversold zone (e.g., crosses up above 20) can be a great confirmation for a long entry, especially when paired with a preceding bullish divergence.
For maximum flexibility, these alerts are fully compatible with TradingView's webhook functionality. By simply entering your Discord webhook URL into the alert configuration, you can have all your trade signals sent directly to a private Discord server. This is invaluable for traders who are away from their desk or want to monitor multiple assets and timeframes simultaneously. Whether you're at work or on the move, you can receive real-time notifications on your phone, complete with the ticker, timeframe, and signal type. This level of automation helps enforce a rules-based trading system and removes the emotion and hesitation that often lead to missed opportunities.
The Momentum Oscillator is an exclusive tool designed specifically for the TradingView platform. Its advanced Pine Script code leverages the full power of TradingView's charting and alert engine, providing a seamless and integrated user experience. It cannot be used on MT4, MT5, or any other charting platform. As a premium TradingView divergence indicator, it is authorized for your specific TradingView username upon access.
One of the indicator's most powerful features is the built-in Multi-Timeframe (MTF) Dashboard. This panel, visible at the bottom of your chart, shows you the state of the Momentum Oscillator across multiple timeframes simultaneously—from the 1-minute up to the daily. It displays whether the oscillator in each timeframe is bullish (above 50), bearish (below 50), or in an overbought/oversold condition. This gives you an immediate, at-a-glance understanding of the overall market structure. For example, a scalper looking for a long entry on the 5-minute chart can quickly verify that the 1-hour and 4-hour timeframes are also showing bullish momentum, dramatically increasing the probability of the trade.
The indicator is universally compatible with any asset class available on TradingView. It has been rigorously tested and proven effective on Forex (e.g., EURUSD, GBPJPY), Indices (e.g., SPY, US30), Cryptocurrencies (e.g., BTCUSD, ETHUSD), and individual Stocks. Because its calculations are based on price action, volume, and momentum, its principles are applicable to any market that has sufficient liquidity and volume data. Whether your focus is on scalping crypto, swing trading forex, or trading 0DTE options on indices, the Momentum Oscillator provides an adaptable and robust analytical edge.
We believe in providing exceptional value and flexible options for traders to access our suite of professional-grade tools. Access to the Momentum Oscillator is managed exclusively through the Whop platform, ensuring a secure and streamlined process. We offer three distinct tiers to suit your commitment level: a monthly subscription for maximum flexibility, a yearly subscription for a significant discount, and a lifetime license for traders committed to long-term mastery.
Your purchase includes more than just the indicator. You receive immediate access to our exclusive Discord community, a thriving hub for traders led by our founder, Andy Tran (@Uncle_the_shooter). In the community, you can collaborate with fellow traders, share chart analyses, and receive direct support from our team. We regularly post trade ideas, educational content, and updates, creating an environment of continuous learning and improvement. This community aspect is a critical part of the Scalping-Algo ecosystem, designed to help you reduce the learning curve and apply the tools more effectively.
Upon completing your purchase on Whop, you will be prompted to provide your TradingView username. Our system will then grant script access to that specific username within minutes. The entire process is automated, allowing you to get the indicator on your charts almost instantly. We stand by the quality of our tools and want you to be completely satisfied. Monthly plans include a 7-day money-back guarantee from the date of your initial purchase — if the Momentum Oscillator is not the right fit, you can request a full refund, no questions asked. Yearly and lifetime plans are final sale and non-refundable, so start on the monthly plan if you would like the refund window.
The Momentum Oscillator is a powerful component of the integrated Scalping-Algo trading system. To further enhance your analytical capabilities, consider pairing it with our other institutional-grade indicators. The /indicators/smart-scalping-signals provides clear, actionable entry and exit signals, while the /indicators/edge-finder offers a comprehensive dashboard view of market conditions. For a complete, all-in-one solution, the /algo-master bundle combines our entire suite of tools. We encourage you to read about our core /methodology to understand the principles behind our creations and visit our /blog for ongoing trading insights and analysis.
These resources are designed to work in concert, providing a multi-faceted and robust framework for discretionary trading. By combining divergence analysis with confirmation signals and a top-down market overview, you equip yourself with a systematic approach to navigating market complexities. Explore our full range of offerings to build a trading process that is as resilient as it is powerful.
Get instant access to Momentum Oscillator plus our full indicator suite, Discord alerts, and a community of 2,000+ active traders.